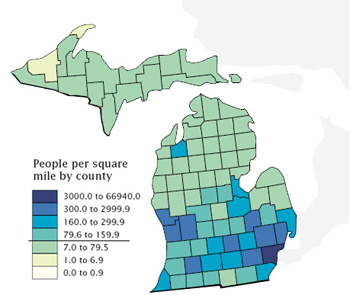
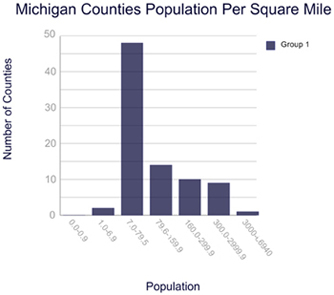
Site Search


Course Navigation

Home| Course Catalog| Career Planning

Free Online Course on World Geography, Weather, Climate & Regions

Lesson 2: What Christopher Columbus and Ptolemy already knew.

CREATE AND INTERPRET GRAPHS.

In lesson 1 you learned that maps are one way that information may be visually represented, and that graphs are another way to represent some of the same information. Figure 2.3.1 and Figure 2.3.2 both represent the number of people per square mile in the state of Michigan, with the information broken down into counties. The map is best at showing where the population is located, and the graph is organized to show how many counties fall into each population category.

Figure 2.3.1, Map of Michigan's population per square mile. (U.S. Census Bureau, 2000. http://www.census.gov/population/cen2000/atlas/censr01-103.pdf)

Figure 2.3.2, Graph of Michigan's population per square mile.(U.S. Census Bureau, 2000. http://factfinder.census.gov/servlet/ThematicMapFramesetServlet?_bm=y&-geo_id=04000US12&-tm_name=DEC_2000_SF1_U_M00090&-ds_name=DEC_2000_SF1_U&-_MapEvent=displayBy&-_dBy=050&-_lang=en&-_sse=on)

What information can you gain from the graph? Are there more counties in Michigan with a dense population? Or are there more counties that are sparsely populated? Are there more counties with a population of 79.6 or more people per square mile? Or are there more counties with a population of less than 79.6 people per square mile?

Figure 2.3.3, Florida's population (U.S. Census Bureau, 2000. http://factfinder.census.gov/servlet/ThematicMapFramesetServlet?_bm=y&-geo_id=04000US12&-tm_name=DEC_2000_SF1_U_M00090&-ds_name=DEC_2000_SF1_U&-_MapEvent=displayBy&-_dBy=050&-_lang=en&-_sse=on)

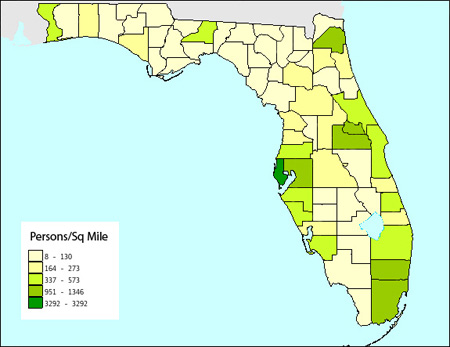
The focus of this objective is for you to obtain data from a map and create a graph to show the information in a different way. This will be similar to objective 3 in lesson 1 and will allow you further opportunity to apply this skill from your toolbox.

Use Figure 2.3.2 as an example for creating your own graph. Your graph will be based on the information found in Figure 2.3.3. This map shows the population of Florida based on the amount of people per square mile in each county. Notice that the black lines are the outlines of all of Florida's counties. As on the map of Michigan, the different colors represent different population categories; for instance, the very darkest color represents the most heavily populated counties in the state.

Now use the map of Florida's population, found in Figure 2.3.3, to create a graph similar to Figure 2.3.2 depicting the number of counties in each of the population categories. Use the graphing tool to make the graph.


Important

Important: Print your graph to answer questions on the Speedback assignment! If you do not have a color printer, you will need to hand-color the map you print.


  This work is licensed under a Creative Commons Attribution-Noncommercial-Share Alike 3.0 Unported License.
For more information about this and other OCW projects at BYU, visit http://ocw.byu.edu.
Creative Commons License

Our Network Of Sites:
Apply 4 Admissions.com              | A2ZColleges.com  | OpenLearningWorld.com  | Totaram.com
Anatomy Colleges.com                | Anesthesiology Schools.com  | Architecture Colleges.com | Audiology Schools.com
Cardiology Colleges.com            | Computer Science Colleges.com| Computer Science Schools.com| Dermatology Schools.com
Epidemiology Schools.com         | Gastroenterology Schools.com  | Hematology Schools.com     | Immunology Schools.com
IT Colleges.com                | Kinesiology Schools.com  | Language Colleges.com  | Music Colleges.com
Nephrology Schools.com             | Neurology Schools.com  | Neurosurgery Schools.com | Obstetrics Schools.com
Oncology Schools.com    | Ophthalmology Schools.com | Orthopedics Schools.com       | Osteopathy Schools.com
Otolaryngology Schools.com| Pathology Schools.com  | Pediatrics Schools.com  | Physical Therapy Colleges.com
Plastic Surgery Schools.com| Podiatry Schools.com  | Psychiatry Schools.com   | Pulmonary Schools.com 
Radiology Schools.com| Sports Medicine Schools.com| Surgery Schools.com | Toxicology Schools.com
US Law Colleges.com| US Med Schools.com | US Dental Schools.com

About Us Terms of Use | Contact Us | Partner with Us | Press Release | Sitemap | Disclaimer | Privacy Policy


©1999-2011 OpenLearningWorld . com - All Rights Reserved