Site Search


Course Navigation

Home| Course Catalog| Career Planning

Free Online Course on World Geography, Weather, Climate & Regions

Lesson 4: Weather and climate: Let's talk about the weather.

CREATE AND INTERPRET MAPS.

You learned to use data and a legend to fill in an outline map in lesson 1. This objective will have you apply this skill again in order to allow you to feel more comfortable with this process.

You will color the map of Michigan to illustrate the population by county using the following legend and information. Use Figure 4.6.6 as an example of how this should be done. You will use this map to answer questions later in the lesson and in the Speedback assignment.

You can open a printable legend if you would like to mark the colors next to the names of the counties before color- coding the map.

Data1
County Population County Population
Allegan 103,655–322,894 Macomb 788,149–2,061,161
Bay 103,655–322,894 Monroe 103,655–322,894
Berrien 103,655–322,894 Muskegon 103,655–322,894
Calhoun 103,655–322,894 Oakland 788,149–2,061,161
Eaton 103,655–322,894 Ottawa 103,655–322,894
Genesee 322,985–788,148 Saginaw 103,655–322,894
Ingham 103,655–322,894 St. Clair 103,655–322,894
Jackson 103,655–322,894 Washtenaw 322,985–788,148
Kalamazoo 103,655–322,894 Wayne 2,061,162 and above
Kent 322,985–788,148 All remaining counties 2,301–103,654
Livingston 103,655–322,894
Legend
Color Population
Orange 2,301–103,654
Green 103,655–322,894
Yellow 322,985–788,148
Blue 788,149–2,061,161
Pink 2,061,162 and above

Color-code the counties on the map using data and legend above. Click a county and you will see the name of that county in larger text in the upper right hand corner of your map exercise, where it says "selected county". After you click the county, check the chart and legend above to find out the number of people per square mile and color the county accordingly. Once you have colored the entire map, click the check button. If the colors are correct, they will remain. If the colors are wrong, they will be erased. Once your map is right, print it so that you can use it for your Speedback assignment. If the map is difficult to read, you can click here to open the map in a pop up window. When you are done working with the map and after you print it, simply close the popup.

Important

Print your map to answer questions later in the lesson and on the Speedback assignment! If you do not have a color printer, you may need to hand-color the map you print.

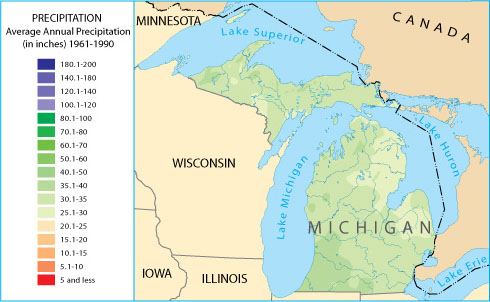
Now compare the colored population map to the precipitation map below.

Figure 4.7.2, Michigan's precipitation. (“Michigan Precipitation Map,” National Atlas of the United States, 2005. http://nationalatlas.gov/printable/images/pdf/precip/pageprecip_mi3.pdf)

Using the population and precipitation maps of Michigan, answer the following questions before reading ahead for the answers.


a. Do the areas of highest population in Michigan also receive the most precipitation?

b. Do all of Michigan's coastlines have similar population levels?


Figure 4.2.1

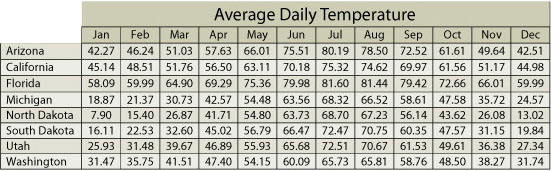
c. Find South Dakota and Michigan in Figure 4.2.1. How do you think the average daily temperatures of the two states compare?

Click Here to Check Your Answers

a. Most areas of Michigan receive adequate rainfall; therefore, precipitation is adequate for settlement in almost any area of Michigan.

b. Several of the most heavily populated counties in Michigan are located along the coasts of the Great Lakes; however, others are located inland.

c. Look at the Average Daily Temperature chart that we examined earlier in Figure 4.2.1. Compare the average daily temperatures of Michigan and South Dakota. Michigan is surrounded by water and South Dakota is not. When you consider the information you have learned about the impact of water on climate, are the comparisons of the temperatures in the two states what you expected? Unlike some ocean currents, the Great Lakes are not particularly warm, nor are they as large as the ocean, so the water does not have quite the same moderating effect that is seen near the ocean.


Footnotes


  This work is licensed under a Creative Commons Attribution-Noncommercial-Share Alike 3.0 Unported License.
For more information about this and other OCW projects at BYU, visit http://ocw.byu.edu.
Creative Commons License

Our Network Of Sites:
Apply 4 Admissions.com              | A2ZColleges.com  | OpenLearningWorld.com  | Totaram.com
Anatomy Colleges.com                | Anesthesiology Schools.com  | Architecture Colleges.com | Audiology Schools.com
Cardiology Colleges.com            | Computer Science Colleges.com| Computer Science Schools.com| Dermatology Schools.com
Epidemiology Schools.com         | Gastroenterology Schools.com  | Hematology Schools.com     | Immunology Schools.com
IT Colleges.com                | Kinesiology Schools.com  | Language Colleges.com  | Music Colleges.com
Nephrology Schools.com             | Neurology Schools.com  | Neurosurgery Schools.com | Obstetrics Schools.com
Oncology Schools.com    | Ophthalmology Schools.com | Orthopedics Schools.com       | Osteopathy Schools.com
Otolaryngology Schools.com| Pathology Schools.com  | Pediatrics Schools.com  | Physical Therapy Colleges.com
Plastic Surgery Schools.com| Podiatry Schools.com  | Psychiatry Schools.com   | Pulmonary Schools.com 
Radiology Schools.com| Sports Medicine Schools.com| Surgery Schools.com | Toxicology Schools.com
US Law Colleges.com| US Med Schools.com | US Dental Schools.com

About Us Terms of Use | Contact Us | Partner with Us | Press Release | Sitemap | Disclaimer | Privacy Policy


©1999-2011 OpenLearningWorld . com - All Rights Reserved