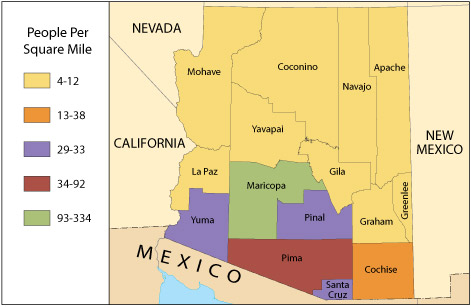
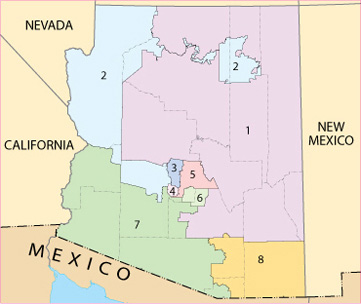
Site Search


Course Navigation

Home| Course Catalog| Career Planning

Free Online Course on World Geography, Weather, Climate & Regions

Lesson 2: What Christopher Columbus and Ptolemy already knew.


ARIZONA

Compare the following two political maps of Arizona. Figure 2.2.4 shows the state's counties. Figure 2.2.5 shows the states congressional districts. All states are divided into voting sections from which U.S. Congress Representatives are elected. The sections are called congressional districts.

Figure 2.2.4, Arizona's counties. (“Arizona County Map,” National Atlas of the United States, 2004. http://nationalatlas.gov/printable/reference.html#list)

Figure 2.2.5, Arizona's congressional boundaries.(National Atlas of the United States, 2005. http://nationalatlas.gov/printable/congress.html#list)


The criteria used to create political boundaries vary. County boundaries may be based on size, natural barriers, or the location of major cities. Congressional districts are drawn on the basis of population and demographics, and tend to shift periodically. In both cases the boundaries are mostly determined by humans. Natural barriers may have some impact, but it is not uncommon to disregard natural barriers when drawing up political boundaries.

Political maps can provide us with different types of information. For example, since congressional districts are based on the amount of people living in an area, you can use them to determine which areas have denser populations. This is because the denser the population is in an area, the less amount of land there will be in the district, whereas the more spread out the population is in an area, the more land there will be in the district. In other words, if every district were limited to 1000 people, a city block might be a district and an area containing 250 farms might be another district. Though the amount of land in each district would vary greatly, in both cases the districts would still have 1000 people. With that information in mind, which district in Figure 2.2.5 do you think has the densest population? Which district do you think has the least dense population?


  This work is licensed under a Creative Commons Attribution-Noncommercial-Share Alike 3.0 Unported License.
For more information about this and other OCW projects at BYU, visit http://ocw.byu.edu.
Creative Commons License

Our Network Of Sites:
Apply 4 Admissions.com              | A2ZColleges.com  | OpenLearningWorld.com  | Totaram.com
Anatomy Colleges.com                | Anesthesiology Schools.com  | Architecture Colleges.com | Audiology Schools.com
Cardiology Colleges.com            | Computer Science Colleges.com| Computer Science Schools.com| Dermatology Schools.com
Epidemiology Schools.com         | Gastroenterology Schools.com  | Hematology Schools.com     | Immunology Schools.com
IT Colleges.com                | Kinesiology Schools.com  | Language Colleges.com  | Music Colleges.com
Nephrology Schools.com             | Neurology Schools.com  | Neurosurgery Schools.com | Obstetrics Schools.com
Oncology Schools.com    | Ophthalmology Schools.com | Orthopedics Schools.com       | Osteopathy Schools.com
Otolaryngology Schools.com| Pathology Schools.com  | Pediatrics Schools.com  | Physical Therapy Colleges.com
Plastic Surgery Schools.com| Podiatry Schools.com  | Psychiatry Schools.com   | Pulmonary Schools.com 
Radiology Schools.com| Sports Medicine Schools.com| Surgery Schools.com | Toxicology Schools.com
US Law Colleges.com| US Med Schools.com | US Dental Schools.com

About Us Terms of Use | Contact Us | Partner with Us | Press Release | Sitemap | Disclaimer | Privacy Policy


©1999-2011 OpenLearningWorld . com - All Rights Reserved