|
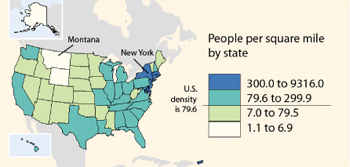
Population mapsSome maps are specifically designed to show the population of the people living in certain areas. These maps may represent the population as a whole or portray various aspects of the population. Figure 2.2.6 shows the average amount of people per square mile living in each state of the US. This map shows us that New York is one of the most densely populated states in the US, and Montana is one of the least densely populated states. If you live in the US, find your state on the map. (If you do not live in the US, pick a state that you are familiar with.) Now see if you can find other states on the map with similar populations. With this map it is easy to get a general idea of whether or not an area has more cities or more sparsely populated areas, and you can make an educated guess about whether or not an area is populated similarly to the area in which you live.
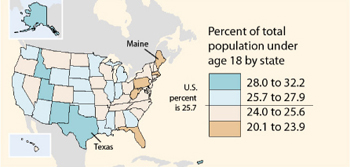
As you can see, there are not very many states with more than 300 people per square mile, nor are there a lot of states with less than seven people per square mile. However, this map does have some drawbacks. For instance, without counting every state in each category it is difficult to accurately guess if there are more states with a population between 79.6 and 299.9 people per square mile or more states with a population of 7.0 to 79.5 people per square mile. Figure 2.2.7 shows the percent of each state that is under the age of 18. Texas has one of the youngest populations in the United States. Maine has one of the oldest populations in the United States. Count the number of states with over 28 percent of the population under the age of 18 years old. Then count the number of states that have less than 25.6 percent of the population under 18 years of age. How do they compare?  
|


About Us | Terms of Use | Contact Us | Partner with Us | Press Release | Sitemap | Disclaimer | Privacy Policy
©1999-2011 OpenLearningWorld . com - All Rights Reserved